Measurement
Task Horizon: Why an Agent's Success Rate Drops as the Task Gets Longer
Task horizon is METR's measured finding that an AI agent's probability of finishing a task correctly falls off as the task's expected human-completion time grows, even holding the model fixed. What the 50%-task-completion time horizon metric actually measures, why the 80% reliability horizon is four to six times shorter than the 50% one, and how the failure mode driving that gap differs across model generations.
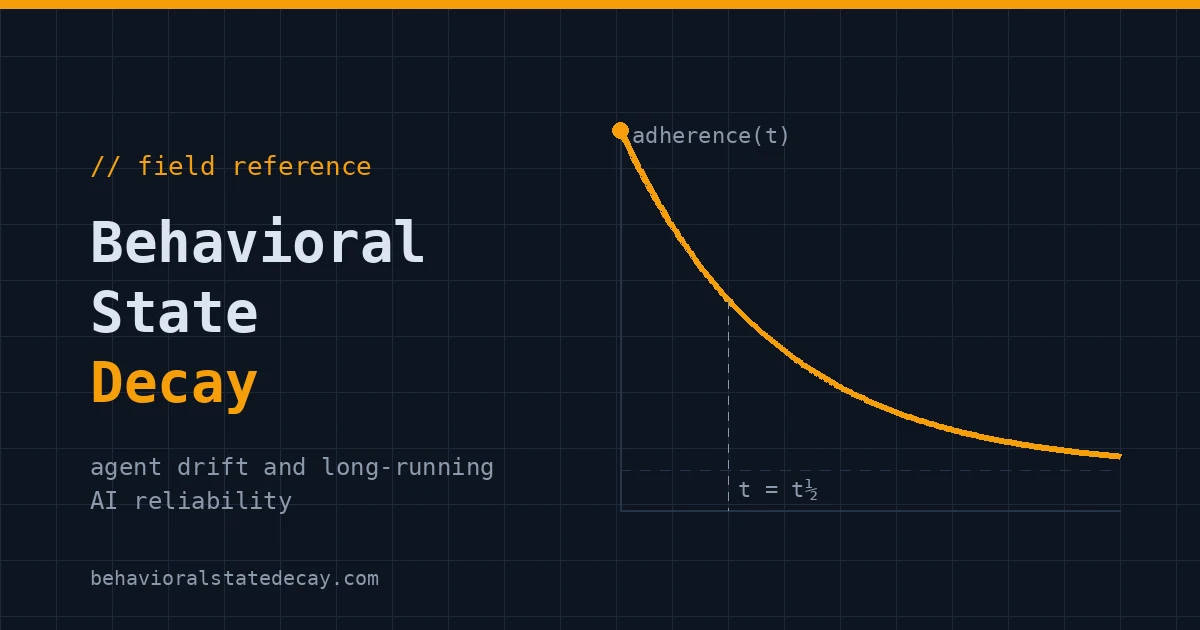
Task horizon is the length of task, measured in the time a skilled human would typically take to complete it, at which a given AI agent's success rate crosses a chosen threshold. The best-known version is METR's 50%-task-completion time horizon: the human-equivalent task duration at which a model succeeds half the time (Kwa, West, Becker, Deng, et al., "Measuring AI Ability to Complete Long Software Tasks," arXiv:2503.14499). It is not a claim about how long a model can run before crashing or exhausting its context; it is an empirical curve showing that, for one fixed model with a fixed context budget, the probability of a correct outcome falls as the task in front of it takes longer to do, and that curve is measurable, comparable across models, and has been tracked since 2019.
This is a macro-level companion to the finer-grained work this site already covers. The Agent Stability Index scores drift within a single running session, sampled across interaction windows. Task horizon instead asks a question before a session even starts: given a task of this expected length, what fraction of attempts should you expect to land correctly at all. The two answer different questions about the same underlying phenomenon, long-running task execution getting less reliable the longer it runs, and the difference in how each is measured is itself informative.
The metric
METR defines the relationship with a logistic function of task length on a log scale: success probability equals the sigmoid of ((log of the model's horizon minus log of the task's time) times a model-specific slope parameter). In plain terms, plot success rate against the logarithm of how long a task normally takes a human, and the curve is well-fit by that logistic shape, with the paper reporting an R² of roughly 0.80 for the regression of model success rate against log human-completion-time. The horizon itself is where that curve crosses 50%. As of the paper's reported figures, Claude 3.7 Sonnet's 50% horizon sits around 50 minutes; the frontier figure cited for o3 is roughly 110 minutes. The trend across model generations since 2019 has the horizon doubling roughly every seven months, with the paper noting the trend may have accelerated since 2024.
That doubling trend describes how the horizon moves across model generations over calendar time. It says nothing about what happens to a single fixed model's reliability as the task in front of it gets longer within one deployment, which is the part of the finding that matters for anyone running an agent in production today rather than extrapolating future capability.
Fifty percent is not a reliability number
The detail most likely to get lost when this metric gets summarized as "model X's horizon is N minutes" is that 50% is a coin flip, not a reliability guarantee. METR also computes an 80% time horizon, the task length at which the model succeeds four times out of five, and the paper reports that 80% horizons run four to six times shorter than 50% horizons for the same model, while the doubling rate for the two is close, 204 days for the 80% horizon versus 207 days for the 50%. Applied to the o3 figure above: a 110-minute 50% horizon implies an 80%-reliable horizon somewhere around 18 to 27 minutes for that same model. A task that the model "can" do, in the sense that measured at 50% it succeeds about half the time, is not the same task as one it reliably does, and a team that validates a new agent deployment against 50%-threshold benchmarks is measuring a materially more optimistic number than the one that matters for anything run unattended.
This is the same distinction agent stopping criteria makes about resource caps: a model completing a task once in an eval is not evidence that it will complete the next instance of that task correctly, and the horizon metric quantifies exactly how much of a gap that is, as a function of task length, rather than leaving it as a qualitative caution.
Two different ways a longer task kills a run
METR's paper also breaks down why longer tasks fail, comparing GPT-4 1106 against o1 on a qualitative failure-category analysis across 31 and 32 failed runs respectively. Two categories move in opposite directions between the two models: "repeating failed actions" drops from 12 occurrences for GPT-4 1106 to 2 for o1, while "premature task abandonment" rises from 8 to 16. The paper notes a caveat worth keeping attached to the comparison: because o1 succeeds at more tasks overall, its failures skew toward the harder end of the task distribution compared to GPT-4's failures, so the shift is not a clean apples-to-apples comparison of the same task set.
Read as a mechanism, not just a table, the two failure categories point at different underlying problems. Repeating failed actions is the loop pattern this site already documents from two angles: it is the observable symptom redundant re-exploration measures when compacted context makes an agent distrust or forget work it already did, and it is one of the signals tool-use drift recommends tracking via fixed-task repetition probes. Premature task abandonment is the mirror failure that agent stopping criteria names directly: a model that quits on an unsupported or incomplete state rather than continuing, converting a recoverable in-progress run into a locked-in wrong answer. A model that got better at not looping can still get worse at knowing when it is actually done, and the horizon curve does not distinguish which failure produced a given data point without this kind of qualitative breakdown underneath it.
The paper also flags a category of task where longer time-to-complete does not fully capture the difficulty: environments without clear feedback loops, or ones where the agent has to proactively seek out relevant information rather than being handed it. That description overlaps with what plan decay covers as stale preconditions: a task can be short in expected human time and still break a model's execution if the environment does not confirm whether each step actually worked.
How this differs from the Agent Stability Index
The two measurement approaches this site covers for long-horizon reliability are grounded differently, and the difference matters for how much weight to put on each. The Agent Stability Index, built on a single-author simulation study, models multi-agent workflows and projects drift effects under the paper's own assumptions; figures drawn from it should be read as projections, not production telemetry, as that article is explicit about. METR's time horizon figures come from actual agent runs against human-baselined tasks, HCAST and RE-Bench style benchmarks where real people timed themselves completing the same work, which makes the horizon numbers an empirical measurement rather than a simulated projection, with the tradeoff that it measures task-completion probability specifically rather than the broader consistency, tool-usage, and coordination dimensions ASI tries to composite into one score.
The two are complementary rather than competing. Task horizon is the number to consult before committing a task to unattended execution: given this task's expected human-completion time, what fraction of attempts should land correctly, and at what reliability threshold. Agent Stability Index-style telemetry is the number to consult once a session is already running, watching for the point where a specific instance degrades relative to its own baseline. A short-horizon task can still drift mid-session; a long-horizon task started with a healthy ASI reading can still fail simply because it was long. Neither metric substitutes for the other.
Measuring it for your own agent
- Bucket your own evaluation tasks by expected human-completion time rather than scoring aggregate accuracy across a mixed set. A single accuracy number across five-minute and two-hour equivalent tasks hides exactly the curve this metric exists to surface.
- Report both a 50% and an 80% (or whatever threshold matches your actual unattended-execution tolerance) reliability horizon, not just one. The gap between the two is itself the number that should inform how long a task you are willing to let run without a checkpoint.
- Classify failures qualitatively, not just as pass/fail, using something like the repeating-actions versus premature-abandonment split above. The two failure modes call for different fixes: loop failures point toward the detection patterns in redundant re-exploration and tool-use drift; abandonment failures point toward the evidence-carrying termination approach in agent stopping criteria.
- Re-run the horizon measurement whenever you materially change the harness, not only when you change the model. Context management, tool surface, and checkpointing all affect where the curve sits, and a horizon measured against last quarter's harness is not evidence about this quarter's.
- Treat a horizon estimate as a property of the model-plus-harness-plus-task-domain combination, not the model alone. METR's cross-model comparisons hold the benchmark suite fixed and vary the model; a horizon number from a public benchmark does not transfer directly to a different task domain without measuring it there.
Related terms
- Behavioral state decay: the umbrella phenomenon task horizon gives one empirical, task-length-indexed measurement of.
- Agent Stability Index: a complementary, simulation-based composite score for within-session drift, contrasted above with task horizon's empirical, task-length framing.
- Agent stopping criteria: the mitigation pattern that targets premature task abandonment, one of the two failure modes behind a shrinking horizon.
- Redundant re-exploration and tool-use drift: the detection patterns that target the other failure mode, repeating failed actions.
- Plan decay: the stale-precondition failure that the paper's "messier environments, unclear feedback loops" category overlaps with.
FAQ
Is task horizon the same as a context window limit? No. Context window limits are a hard architectural ceiling on input size. Task horizon is an empirical reliability curve: a model can be well within its context budget for a given task and still fail it more often simply because the task takes longer, in human-equivalent time, to complete correctly.
Does a longer horizon mean a model is strictly better at long tasks? It means the model's 50%-success point sits further out on the task-length curve. It says nothing on its own about the 80% horizon gap or about which failure category, looping or premature abandonment, dominates its remaining failures; both matter more for a production deployment than the headline horizon number.
Can I compute a horizon number without the exact METR benchmark suite? Not the same absolute number, since the horizon is measured against a specific human-baselined task set, but the method transfers: bucket your own tasks by expected human-completion time, fit success rate against log task length, and read off where your chosen reliability threshold crosses. The curve shape and the 50%-versus-80% gap are the parts of the finding that generalize; the specific minute counts are specific to METR's benchmark and your own harness.
Why does the 80% horizon matter more than the 50% one for production use? Most unattended or high-stakes agent deployments cannot tolerate a coin-flip success rate. The 80% horizon is the more honest number for the question "how long a task can I hand this agent without expecting it to fail outright roughly one time in five," and the four-to-six-times gap between the two thresholds means relying on the 50% figure alone systematically overstates how long a task the agent can actually be trusted with.